What is Net Promoter Score (loyalty index)
Net Promoter Score (NPS) — "loyalty index" that measures customer willingness to recommend a product/service to friends or colleagues (0–10 scale). The concept was published by Frederick Reichheld in Harvard Business Review (2003); methodology was further developed by Bain & Company and Satmetrix (Net Promoter System).
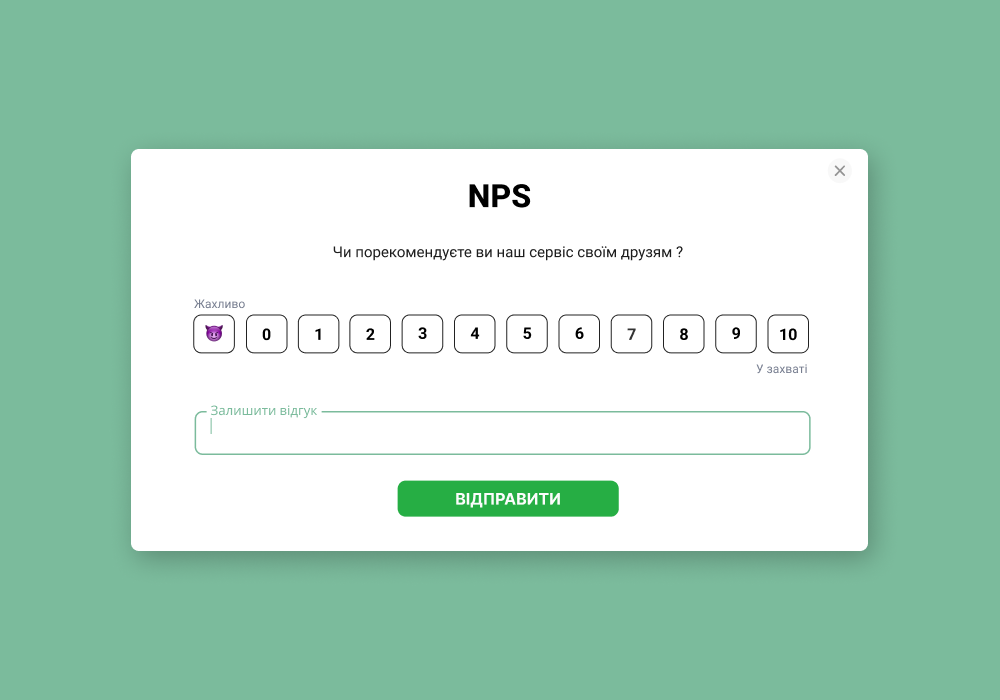
After answering, customers are divided into 3 groups: detractors (0–6), passives (7–8), promoters (9–10). This is the classic system described in Ukrainian guides.
How to calculate NPS (with examples)
Types of NPS and when to ask
Relational NPS (relationship) — periodic surveys (e.g., quarterly/semi-annually) to assess brand "health" and benchmarking.
Transactional NPS (transactional) — immediately after key interaction: purchase, delivery, support contact, onboarding completion. Provides tactical insights at touchpoint level.
Timing. For digital products, often works cycle: 7–15 days after installation/first use; then repeat after 30–90 days; for continuous services — every ~90 days.
Best NPS practices (short checklist)
Simplicity and consistency of methodology. Same wording, one scale, transparent audience selection logic.
Correct touchpoints (transactional) + periodic waves (relationship).
Follow-up. Ask for rating reason and close the loop (contact/decision fixation in CRM).
Measure dynamics, not just absolute. Look at trend by channels/segments/functions.
Data ethics. Don't incentivize "9–10" with bonuses — this distorts the metric.
NPS statistics without pain: error, CI, sample size
How to convert NPS into business results
Cohort & journey analysis. Calculate NPS by segments (new vs repeat, regions, products, channels).
Driver analysis. Code open comments → topics → impact on NPS/churn → backlog.
Connection with financial results. Compare churn and LTV between groups; set OKRs for "detractor containment" (detractor processing within X days) and promoter activation (how many referrals/reviews activated).
Limitations and common mistakes
NPS ≠ "holy grail". Research (Keiningham et al., Journal of Marketing, 2007) showed that NPS is not always a better predictor of growth than alternatives (CSAT etc.). Keep a set of metrics (NPS + CSAT + CES + behavioral KPIs).
"Gaming" the metric. KPIs sometimes provoke "squeezing out" 9–10 — this kills diagnostic value (see modern discussion around NPS 3.0).
Survey microtexts (ready phrases)
Main question: "How likely are you to recommend [company/product name] to a friend or colleague? (0 — not at all likely, 10 — extremely likely)".
Follow-up (open): "What was the main reason for your rating?" / "What should we change for you to rate 2 points higher?"
Frequently asked questions (FAQ)
What is considered a "good" NPS?
Depends on niche and country. Look at external benchmarks (NICE Satmetrix), but make decisions based on your own trend and CI.
How does NPS differ from CSAT/CES?
NPS — about willingness to recommend, CSAT — about satisfaction with specific interaction, CES — about effort to solve a task. Combine them.
How much and how often to survey?
For product services — always-on transactional NPS at key points + periodic relational (quarterly/semi-annually). For mobile applications — cycle 7–15 days → 30–90 days.